Climate Adaptation Engineering
Graphic created by Lally LLC to show relative sea level trends, as measured by NOAA with data from the NWLON and the PSMSL. Basemap Sources: Esri, USGS, NOAA.
Identifying and Managing the Threat
Coastal communities have always faced the risks of storm-induced winds, wave forces, and flooding. In many parts of the world, climate change is intensifying these hazards.
A reliable and long-standing body of scientific data informs us the threats to human life, infrastructure and the environment as a result of climate change are real and expanding. In coastal and marine environments, sea level rise and the intensity of tropical cyclones (i.e. hurricanes, typhoons, tropical storms) is being driven by global warming, specifically, rising sea surface temperatures. This translates to increases in flooding, wave and storm surge heights, rainfall and stronger winds, over wider areas. Lally Engineering & Consulting LLC (Lally LLC) offers its expertise to help assess and manage these threats.
Climate change encompasses global warming and its impacts on earth’s weather patterns. While there have been previous periods of climate change due to natural causes, our current changes are distinctly more rapid and caused by the society-driven (anthropogenic) emission of greenhouse gases, mostly carbon dioxide (CO2) and methane (CH4). Burning fossil fuels for energy production, and certain industrial, agricultural and forest loss processes are some of the foremost contributors to these emissions.
Greenhouse gases are transparent to sunlight, allowing it through to heat the Earth’s surface. When the Earth emits this heat as infrared radiation, the Greenhouse gases absorb it, trapping the heat near the Earth’s surface and causing global warming.
As temperatures rise due to global warming there are impacts on weather patterns. Related to ocean and coastal environments, the United States National Oceanographic and Atmospheric Administration (NOAA) and United States Environmental Protection Agency (EPA) perform extensive ongoing analyses of climate change trends and impacts.
Ocean Temperature Rise
The increase of the concentration of greenhouse gases in the atmosphere since the industrial era has led to an Earth radiative imbalance and an accumulation of energy within the climate system. Most of this energy has been absorbed by the ocean through heat uptake, contributing to the gradual rise of the Sea Surface Temperature (SST) observed in the 20th century. (NOAA, 2023a).
From 1901 through 2020, the SST of the world’s oceans rose at an average rate of 0.14°F (0.08°C) per decade. SST has been consistently higher during the past three decades than at any other time since reliable observations began in 1880. (EPA, 2023a).
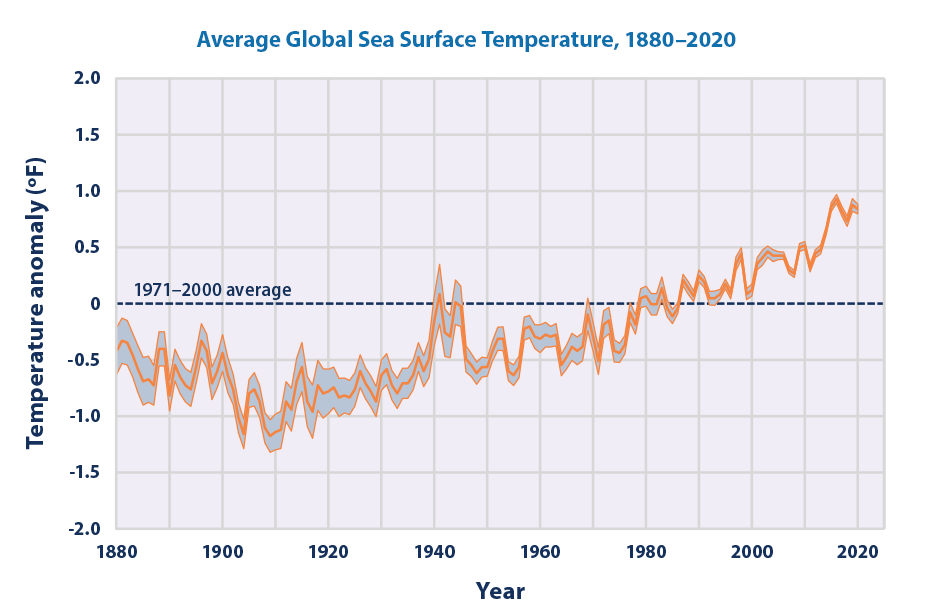
Changes in SST vary regionally. While most parts of the world’s oceans have seen temperature rise, a few areas have experienced cooling, including parts of the North Atlantic. (EPA, 2023a).
Figure 2. Animation of Ocean Heat Content for the upper 6562 ft (2000 m) of the ocean (5-year averages or pentads: 1955-59 to 2016-20). Red areas gained heat compared to the long-term average, and blue areas lost heat. (NOAA NCEI, 2023).
Increasing ocean heat content contributes to sea level rise, ocean heat waves, melting of coastal glaciers and polar Ice caps, and environmental impacts like coral bleaching. Heat stored in the ocean will eventually be released, committing Earth to additional surface warming in the future. (NOAA, 2023a).
Sea Level Rise
One of the most significant impacts of climate change is sea level rise, which can lead to increased flooding of coastal areas and islands, shoreline erosion, land loss and environmental damage. (EPA, 2023b).
Global average sea level has risen 8-9 inches (21–24 cm) since 1880. In 2021, global sea level rise set a record high: 3.8 inches (97 mm) above 1993 levels. The rate of sea level rise is accelerating, more than doubling from 0.06 inches (1.4 mm) per year throughout most of the 20th century, to 0.14 inches (3.6 mm) per year from 2006-2015. (NOAA, 2022a).
Sea level along the U.S. coastline for example is projected to rise, on average, 10-12 inches (0.25-0.30 m) in the next 30 years (2020-2050), which will be as much as the sea level rise measured over the last 100 years (1920-2020). Sea level rise will vary regionally because of changes in both land and ocean height. (NOAA, 2022b).
With significant reductions in greenhouse gas emissions, the U.S. sea level in 2100 is projected to be about 2 ft (0.6 m) higher on average than it was in 2000. On a pathway with higher greenhouse gas emissions and rapid ice sheet collapse, forecast models project that average sea level rise for the contiguous United States could be as high as 7.2 ft (2.2 m) by 2100 and 13 ft (3.9 m) by 2150. (NOAA, 2022a).
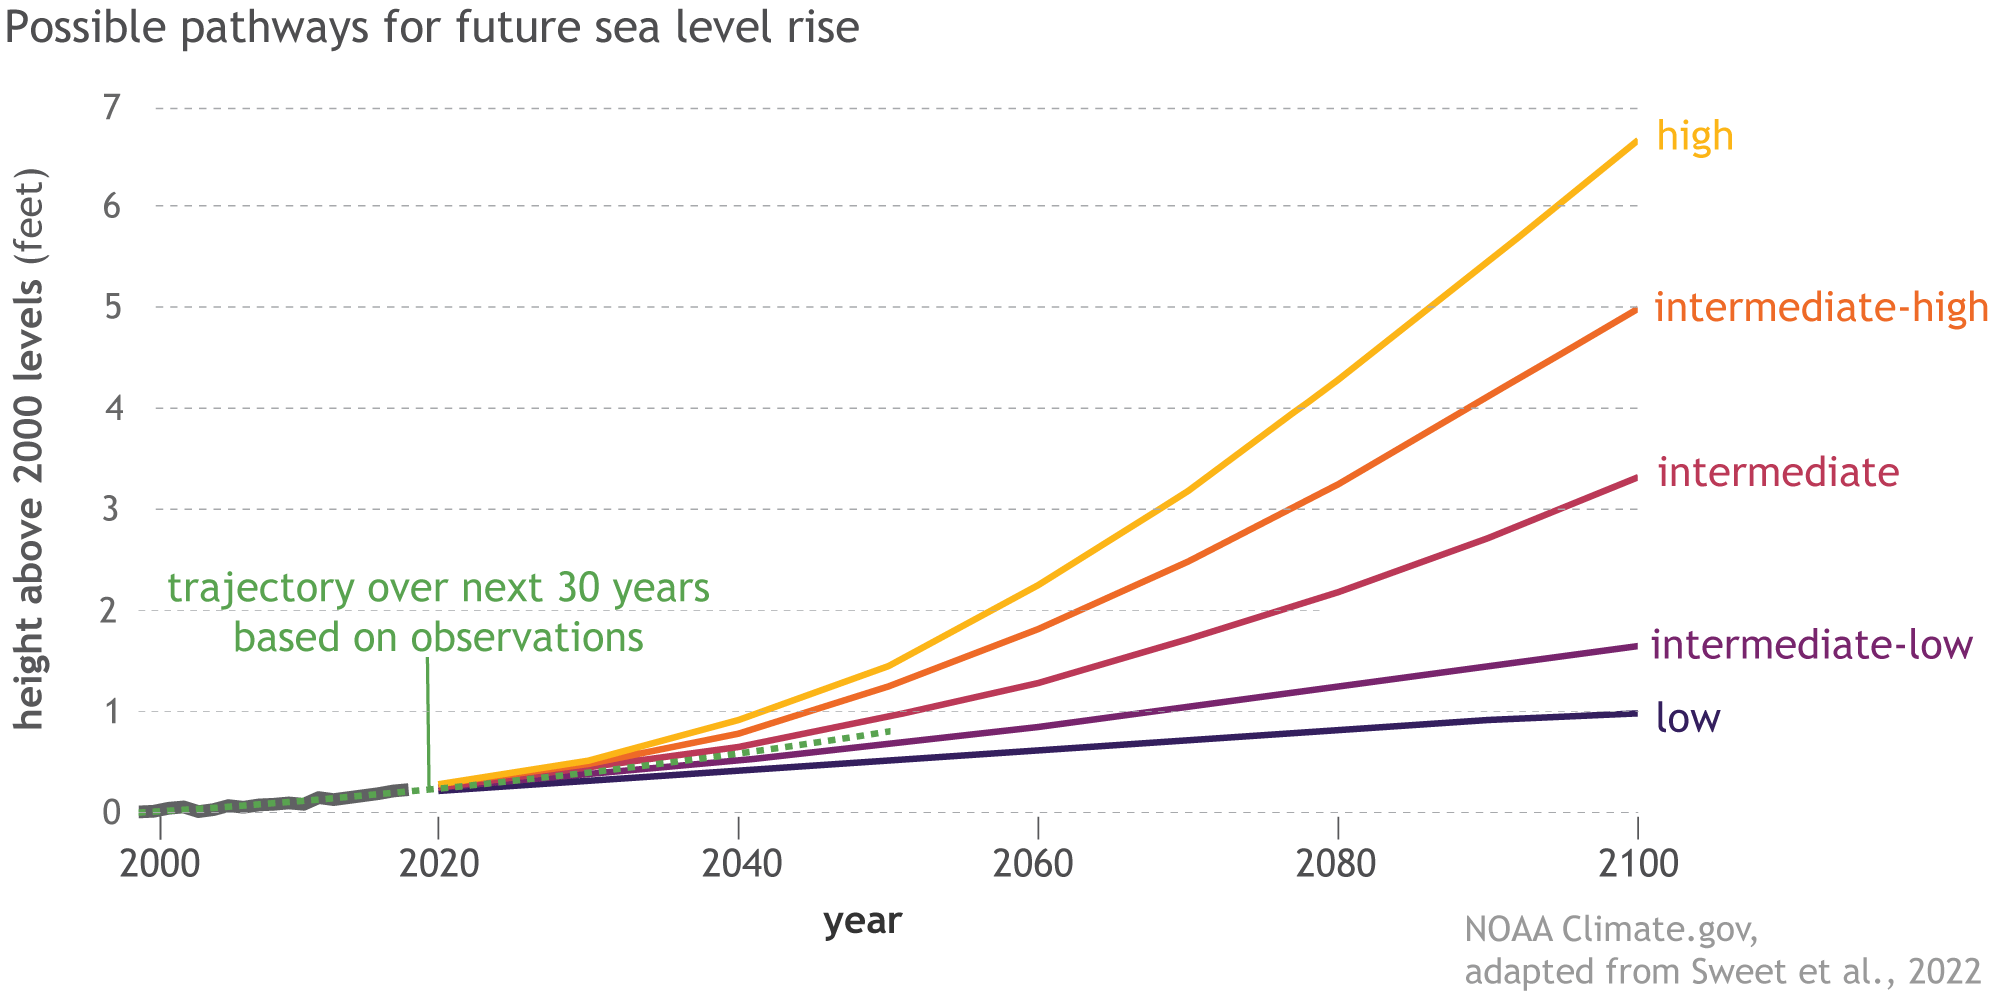
While global sea level has steadily increased in recent decades due to climate change, regional trends vary, and sea level has decreased in some locations. Local or ‘Relative’ sea level rise describes the rate at which the sea surface height is rising or falling relative to a land-based reference in a coastal location. (EPA, 2023c).
The graphic below presents relative sea level trends, as measured by NOAA at 142 long-term water level stations of the National Water Level Observation Network. The trend analysis also encompasses 240 global tide stations using data from the Permanent Service for Mean Sea Level (PSMSL).
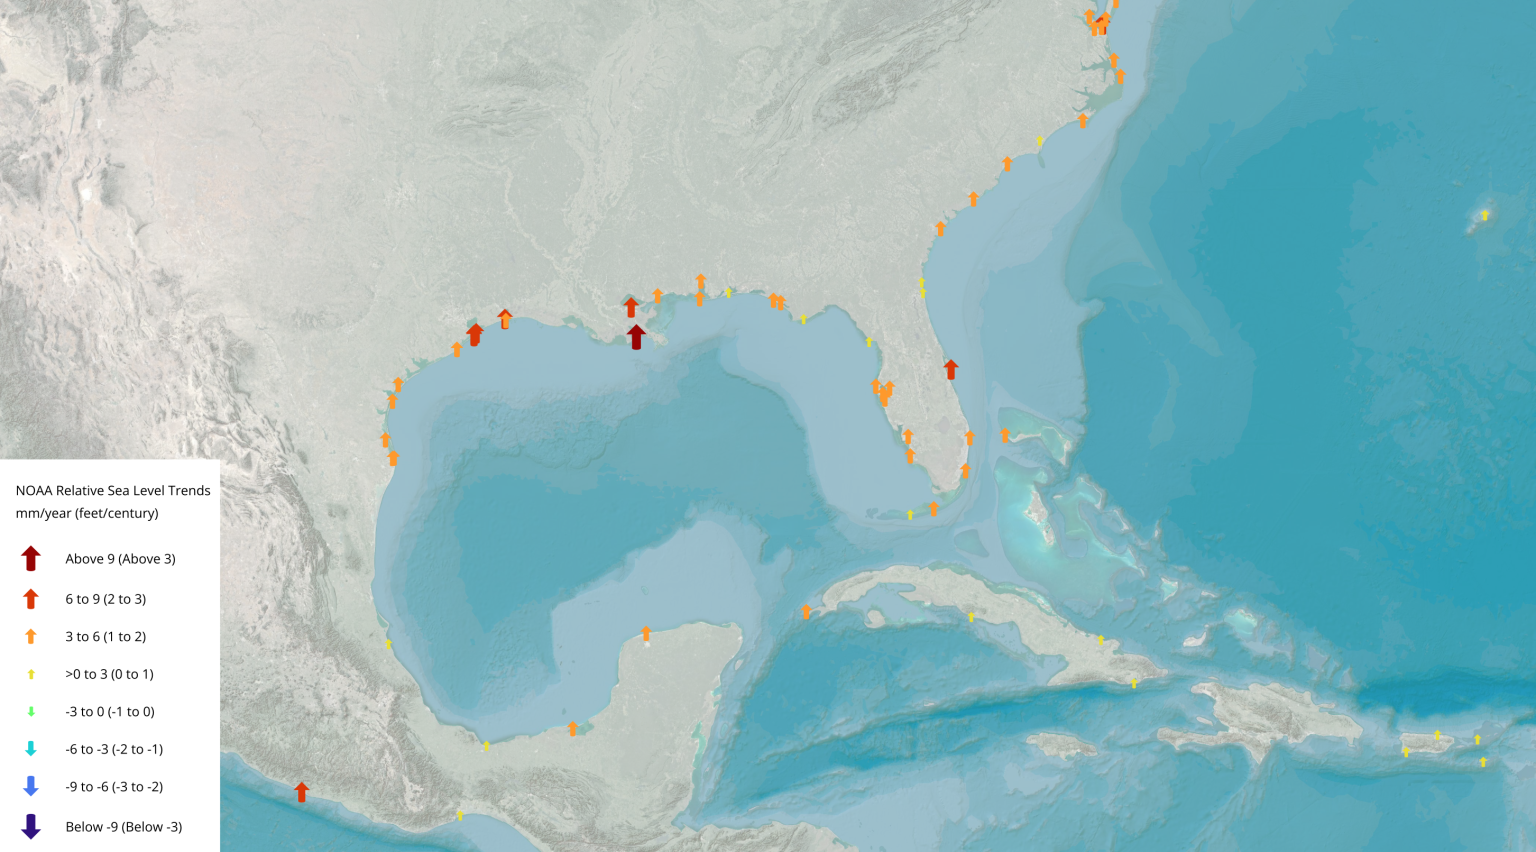
Between 1960 and present day, relative sea level has risen along much of the U.S. coastline, particularly along the Mid-Atlantic coast, and much of the Gulf coast, where some NOAA stations registered increases of more than 8 inches (21 cm). In certain coastal zones, like Louisiana, sea level rise is compounded by land subsidence to create relative sea level rates more than three times global trends. Meanwhile, relative sea level is falling at some locations in Alaska and the Pacific Northwest. In these regions, even though absolute sea level has risen, the land elevation has risen more rapidly. (EPA, 2023c).
High-tide flooding is already a serious problem in many coastal communities, and it is expected to get much worse in the future. In many locations along the U.S. coastline, high-tide flooding is now 300% to over 900% more frequent than it was 50 years ago. (NOAA, 2022a).
Sea level rise will create a significant shift in coastal flooding patterns over the next 30 years by causing tide and storm surge heights to increase and reach further inland. By 2050, “moderate” (typically damaging) flooding is expected to occur, on average, more than 10 times as often as it does today and may be intensified by local factors. (NOAA, 2022b).
Coastal communities, infrastructure and ecosystems will face significant consequences and warrant risk-reduction measures. (Sweet et al., 2022).
Hurricane Frequency and Intensity
The proportion of hurricanes and other tropical cyclones that reach very intense (Category 4 and 5) levels worldwide is projected to increase due to global warming over the 21st century. However, most climate model studies project the total number of hurricanes and other tropical cyclones each year will decrease or remain approximately the same. (NOAA GFDL, 2023).
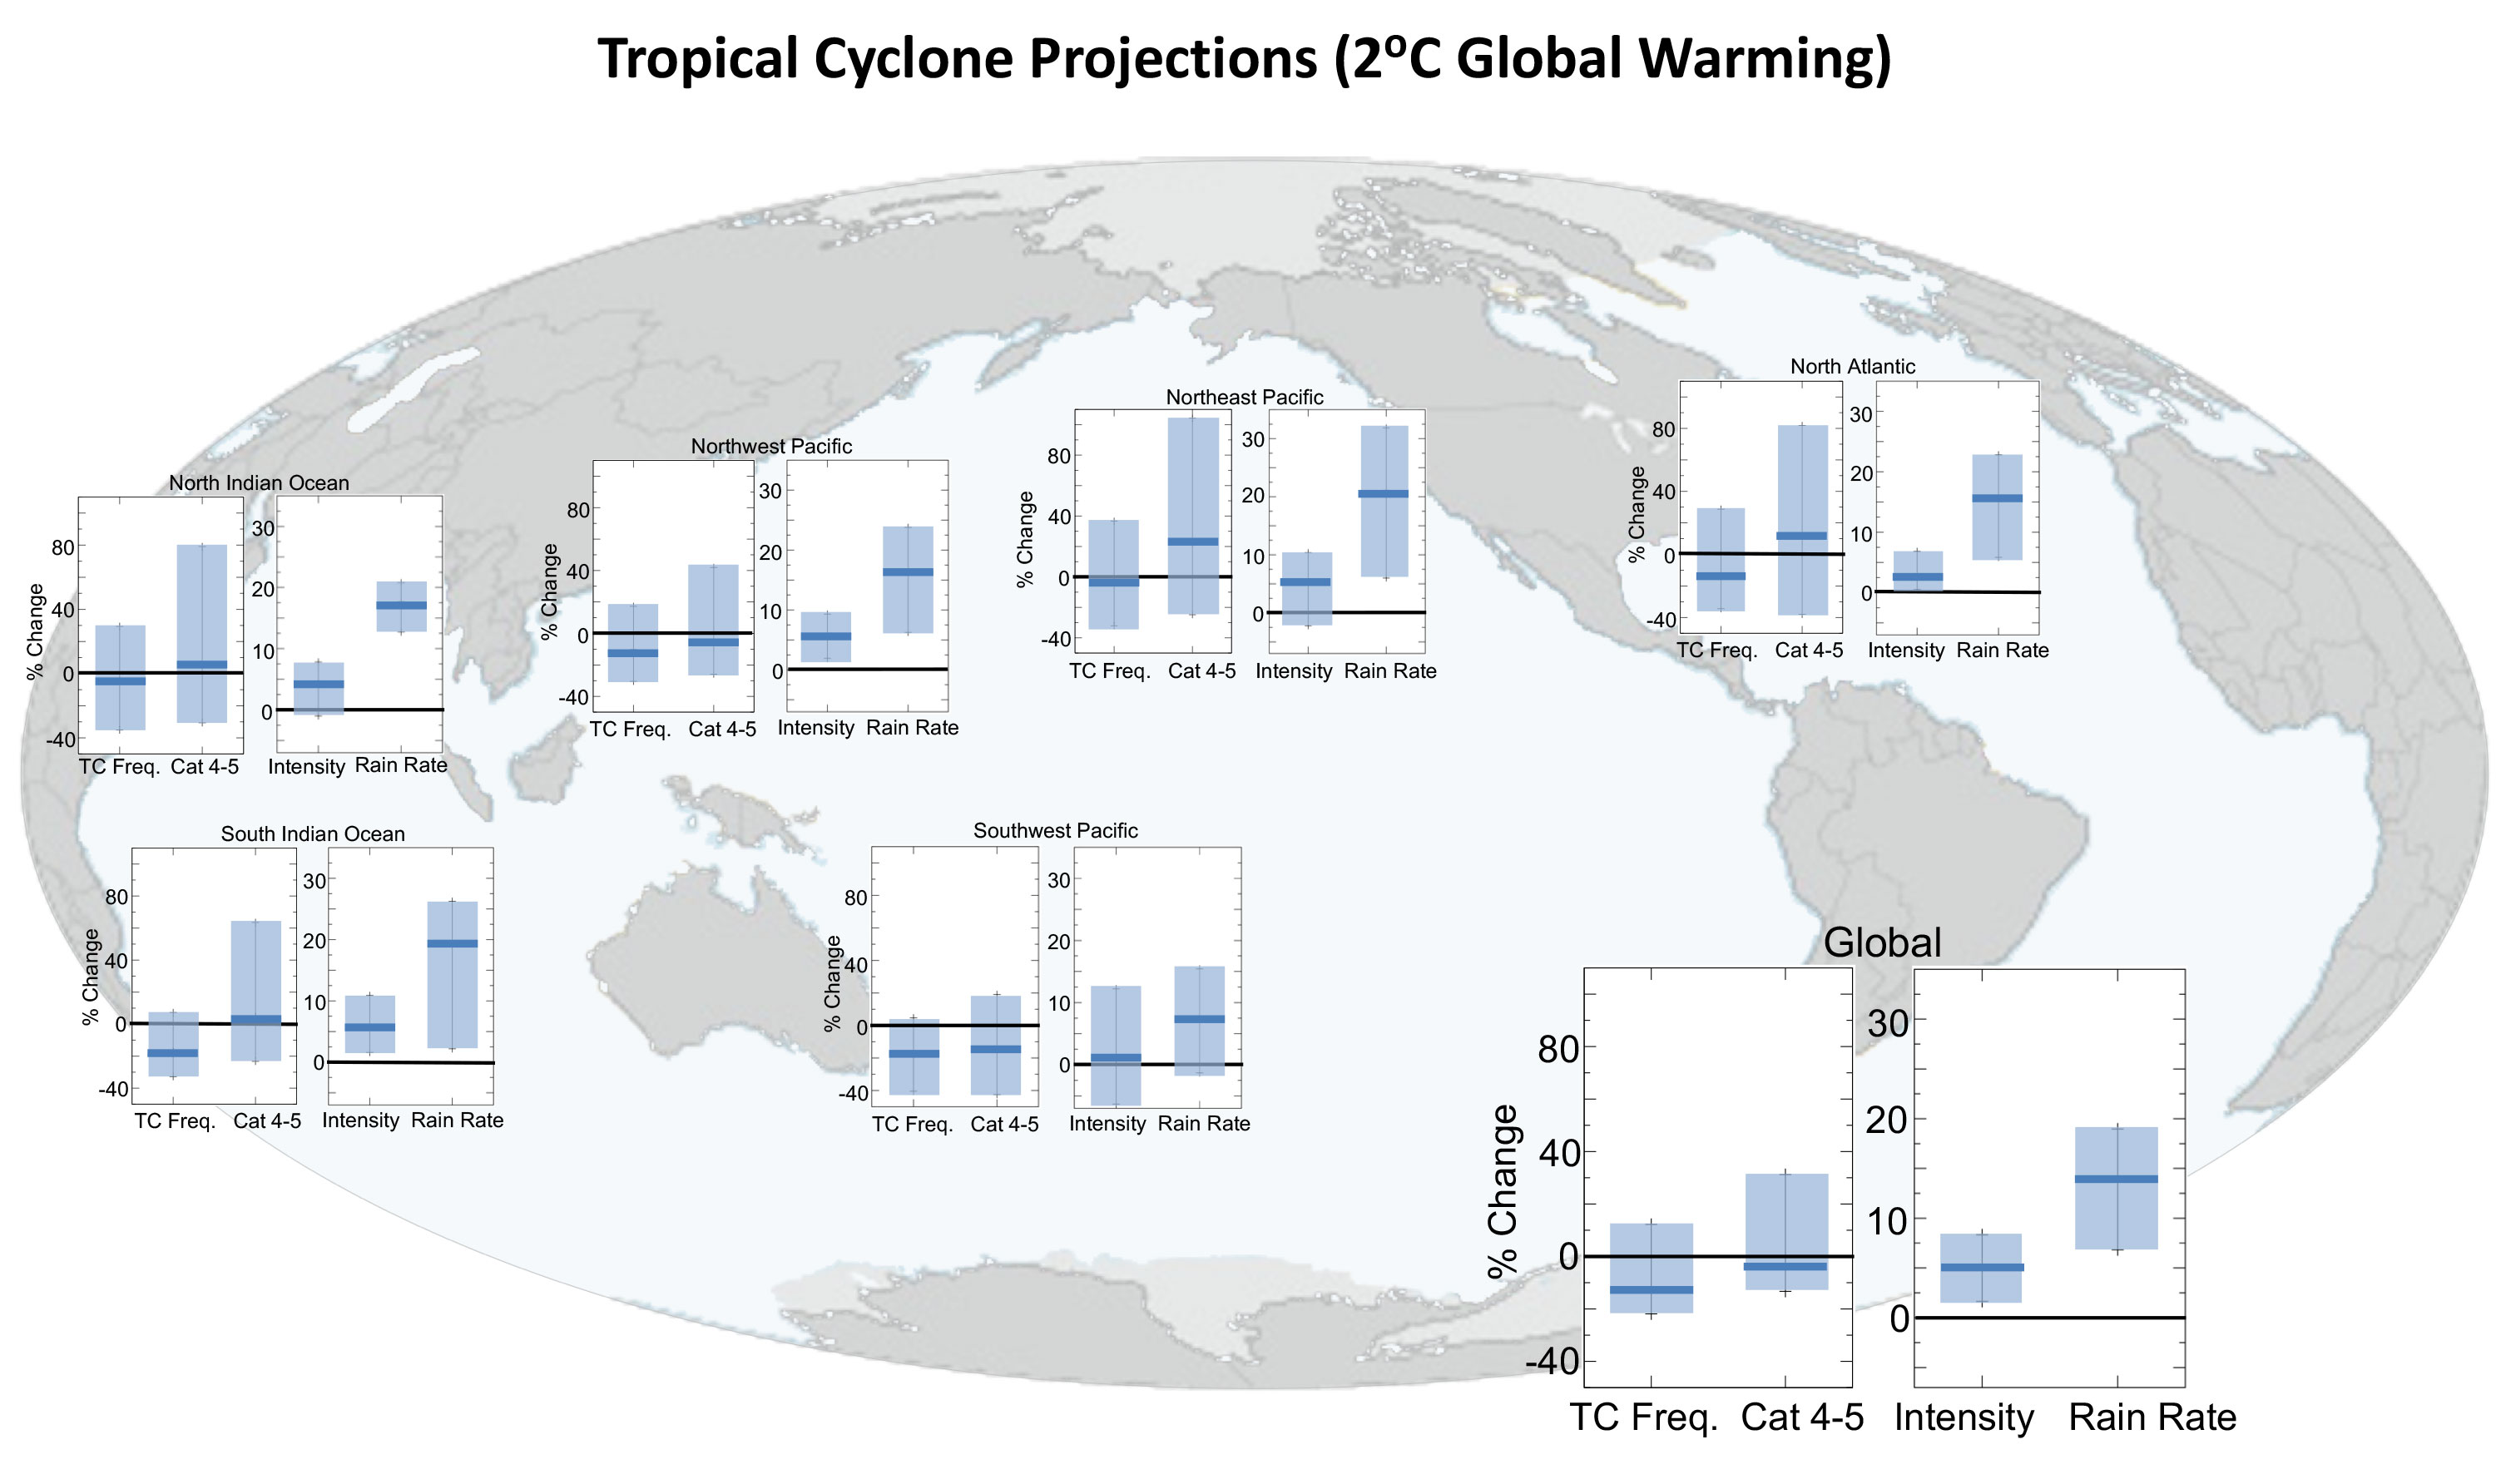
Tropical cyclone intensities globally are projected to increase on average by 1 to 10% according to model projections for a 3.6°F (2°C) global warming scenario. This change would imply an even larger percentage increase in the destructive potential per storm. (NOAA GFDL, 2023).
The intensity (maximum winds) of tropical storms and hurricanes is anticipated to increase about 3% in the Atlantic for example. Wind damage potential increases at an exponential rate to windspeed, i.e. a 3% increase in wind speed could lead to a ~10% increase in damage potential. (NOAA, 2022c).
Tropical cyclone rainfall rates are projected to increase in the future due to global warming, and accompanying increase in atmospheric moisture content. Modeling studies project an increase on the order of 10-15% for rainfall rates averaged within about 62 mi (100 km) of the storm for a 3.6°F (2°C) global warming scenario. This would also increase the risk of flash flooding. (NOAA GFDL, 2023).
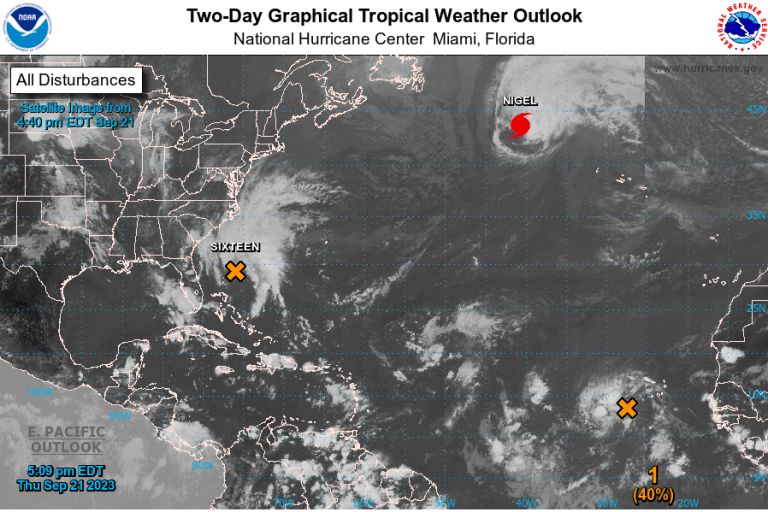
Additional changes for tropical cyclones resulting from global warming, observed and projected, include the poleward migration of the latitude of maximum intensity, increasing rates of rapid intensification, and a slowing of the forward motion of tropical cyclones in places. (NOAA GFDL, 2023).
Figure 6. Animation of low-level wind speeds from a three month simulation using the GFDL Zetac regional atmospheric model. Model-generated tropical storms, hurricanes, and strong extratropical storms are apparent as wind speed maxima that travel through the domain. Red colors roughly denote surface wind speeds above hurricane strength >108 ft s-1 (33 m s-1). (NOAA GFDL, 2008).
References
- NOAA, 2023a. Climate Change: Ocean Heat Content. Climate.gov.
- EPA, 2023a. Climate Change Indicators: Sea Surface Temperature.
- NOAA NCEI, 2023. In Hot Water: Ocean Heat and Our Warming World. NOAA National Centers for Environmental Information.
- EPA, 2023b. Climate Change Indicators: Coastal Flooding.
- NOAA, 2022a. Climate Change: Global Sea Level.
- NOAA, 2022b. 2022 Sea Level Rise Technical Report. National Ocean Service.
- NOAA, 2023b. Possible Pathways for Future Sea Level Rise. Climate.gov.
- EPA, 2023c. Climate Change Indicators: Sea Level.
- NOAA, 2023c. Relative Sea Level Trends. Tides & Currents.
- Sweet, W.V., B.D. Hamlington, R.E. Kopp, C.P. Weaver, P.L. Barnard, D. Bekaert, W. Brooks, M. Craghan, G. Dusek, T. Frederikse, G. Garner, A.S. Genz, J.P. Krasting, E. Larour, D. Marcy, J.J. Marra, J. Obeysekera, M. Osler, M. Pendleton, D. Roman, L. Schmied, W. Veatch, K.D. White, and C. Zuzak, 2022: Global and Regional Sea Level Rise Scenarios for the United States: Updated Mean Projections and Extreme Water Level Probabilities Along U.S. Coastlines. NOAA Technical Report NOS 01. National Oceanic and Atmospheric Administration, National Ocean Service, Silver Spring, MD, 111 pp.
- NOAA GFDL, 2023. Global Warming and Hurricanes. NOAA Geophysical Fluid Dynamics Laboratory.
- NOAA, 2022c. Can we expect Atlantic hurricanes to change over the coming century due to global warming? Climate.gov.
- NOAA GFDL, 2008. Data Visualizations – Hurricanes: Boundary Layer Wind Speed. NOAA Geophysical Fluid Dynamics Laboratory.
Communities and business operators that adapt to the threats of climate change will be those that are safer, more resilient and reduce operations costs in the long term.
From our offices in North America, Europe and the Caribbean, Lally coastal engineers and dredging experts offer a comprehensive range of Climate Adaptation Services, from identification and assessment of hazards, to developing resiliency strategies and engineered flood and erosion control solutions.
We have specific experience in the following areas;
- Local Sea Level Rise Assessment
- Tropical Cyclone (i.e. Hurricane, Typhoon) Hindcasting and Forecasting
- Shoreline Morphology Analyses
- Oceanographic Data Collection
- Wave Statistics
- Numerical Modeling of Coastal and Estuarine Hydrodynamic Processes
- Wave, Tides and Currents Modeling
- Storm Surge Prediction
- Flood Mapping
- Engineering Design of Beach Restoration and Nourishment Projects
- Engineering Design of Shoreline Erosion Control Structures
- Nature-based Solutions
- Dune Engineering Restoration
- Vegetation Studies
- 3D Visualizations
- Contract Plans and Specifications
- Procurement Support
- Stakeholder Engagement
- Environmental Permitting
- Project Management
- Construction Oversight
- Compliance Monitoring
- Pre-, Progress and Post-Dredge and Fill surveys
- Payment Requests and Contract Management
- Dispute Resolution / Expert Services
As sole-source independent consultant, or member on inter-disciplinary team, we are often called to serve on projects requiring specialized coastal or dredging engineering expertise. In these capacities Lally LLC has been hired by governments (U.S. Department of Defense, U.S. Army Corps of Engineers, U.S. Environmental Protection Agency, Federal Emergency Management Agency), industry clients, engineering and environmental consultancies, marine contractors, municipalities, private estates and NGOs.
Related to climate change and coastal resiliency, our firm’s professional staff has also served on expert panels charged with review and formulation of engineering designs, dredged material management, and numerical modeling for coastal risk and resiliency assessment.
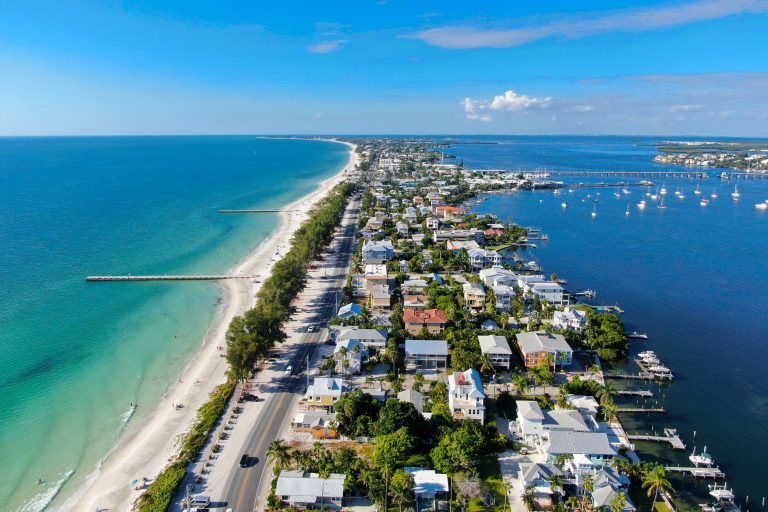
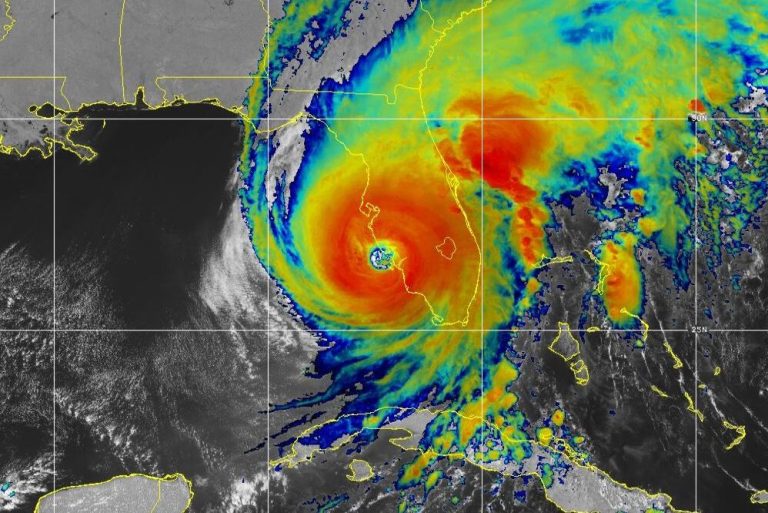
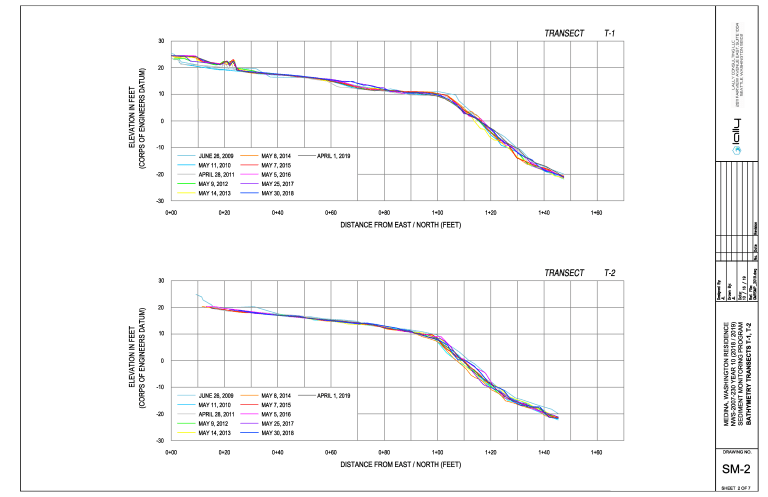
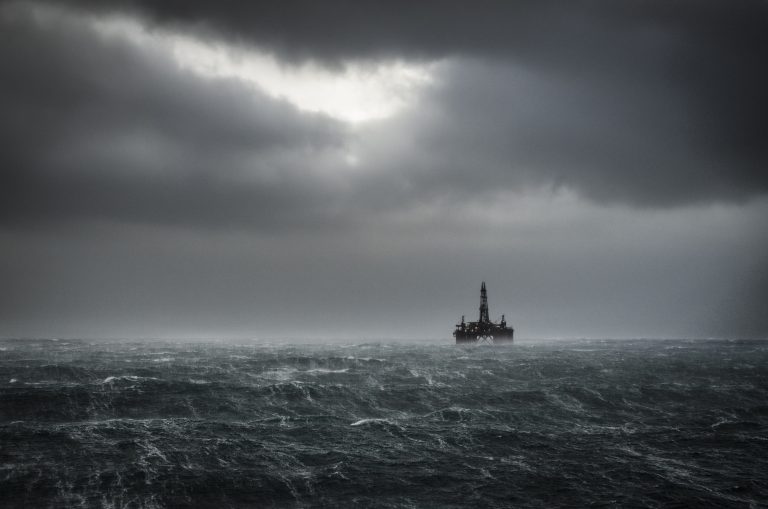
Managing the threat of storm-induced waves, surge, and flooding through resiliency planning starts with in-depth analysis of hindcast storm conditions, MetOcean trends, and prediction of future conditions. For most coastal and offshore sites, we are foremost interested in tropical cyclones (i.e. hurricanes, tropical storms), and relative sea level change.
In some areas sea level rise is prevalent, and can be compounded by subsidence, whereas other areas are experiencing sea level lowering due to tectonic plate rising and other factors. In some coastal regions analysis of seismic activity is also important as it relates to tsunami preparedness. We acquire information through a system of public and commercial databases and apply statistical and other analyses to yield forcing conditions for specific locations and recurrence intervals of interest.
Geographic Information Systems (GIS) and remote sensing, global tropical cyclone and MetOcean databases and statistics, and advanced hydrodynamic modeling software are some of the key tools our engineers employ in the analyses of specific sites or regions. Typically involving hindcast storm track and intensity, tides, waves, storm surge, relative sea level change, and geomorphological data, we can forecast site-specific future trends for hazards assessments, resiliency planning and engineered solutions development.
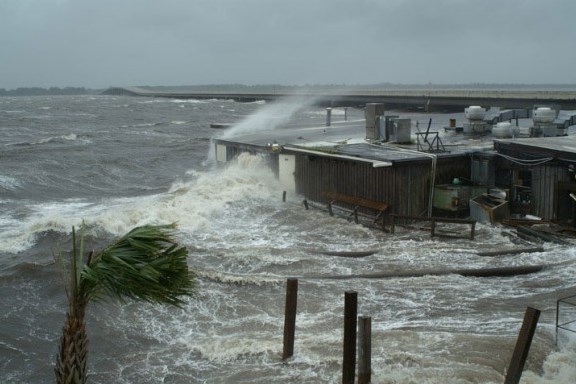
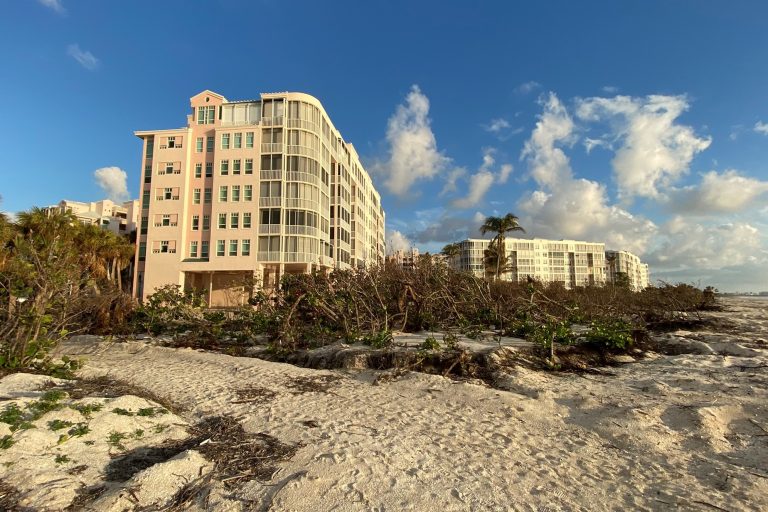
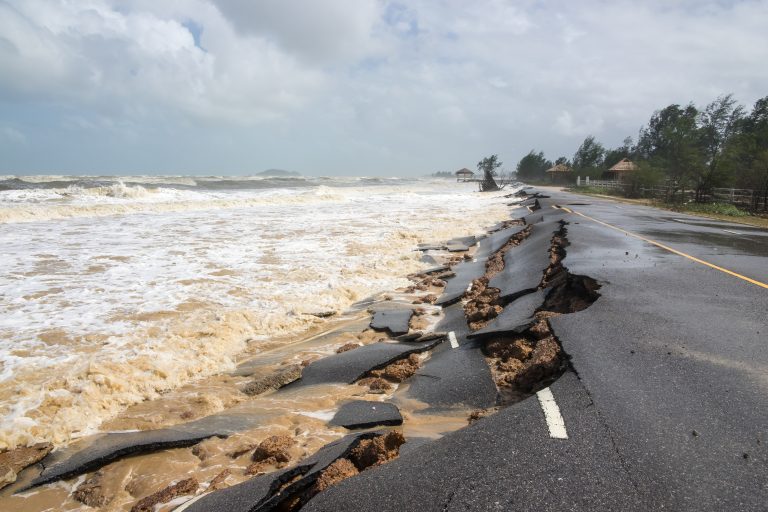
Hurricanes and tropical storms generate dangerous waves, flooding and winds capable of moving large amounts of sand and destroying infrastructure.
For existing property owners and prospective buyers, we offer natural hazard assessment studies to help identify potential short-term and long-term risks due to storms, namely storm surge and storm tides, high winds, and flooding.
With natural hazards assessments that are structured and robust, coastal owners and operators can perform resiliency planning to be able to swiftly monitor, respond to, and resume operations following significant climate events.
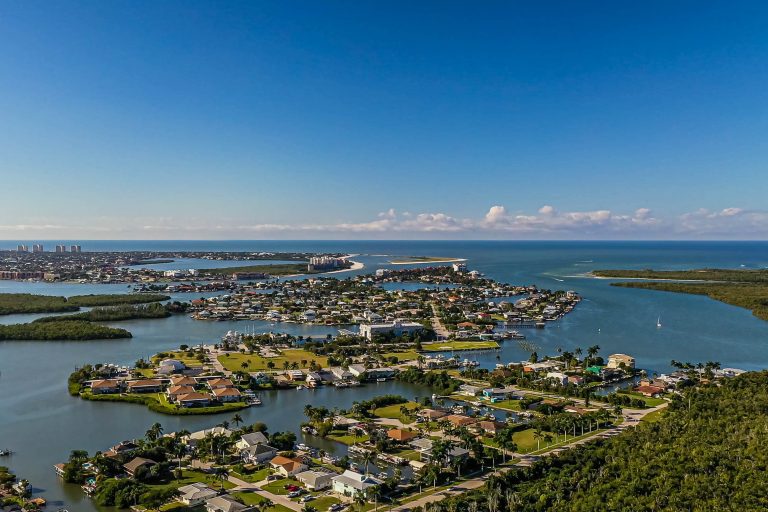
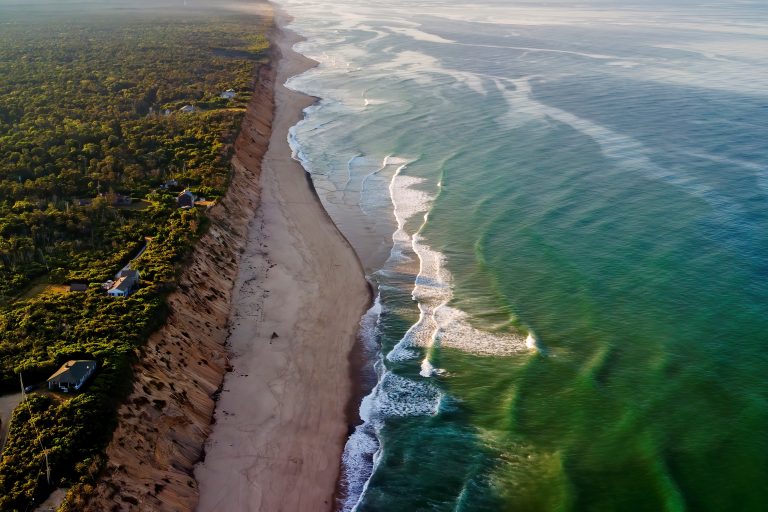
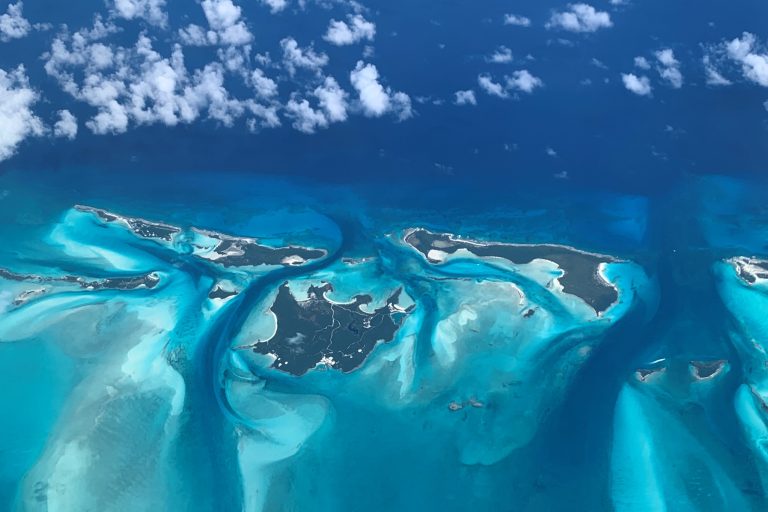
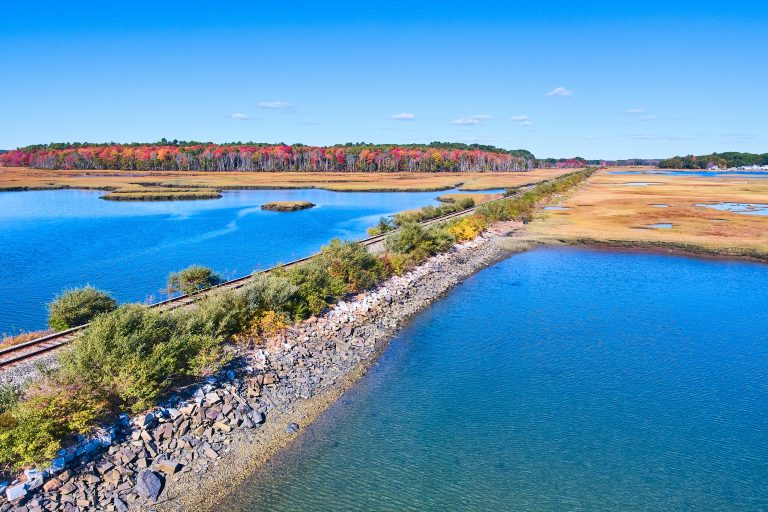
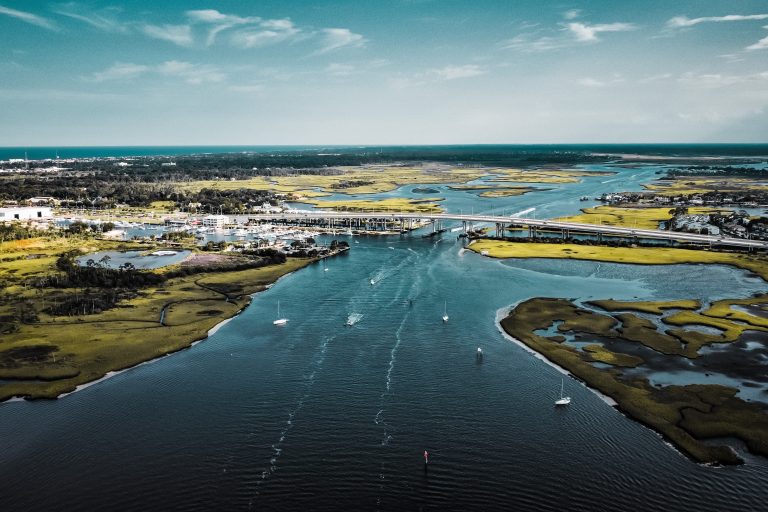
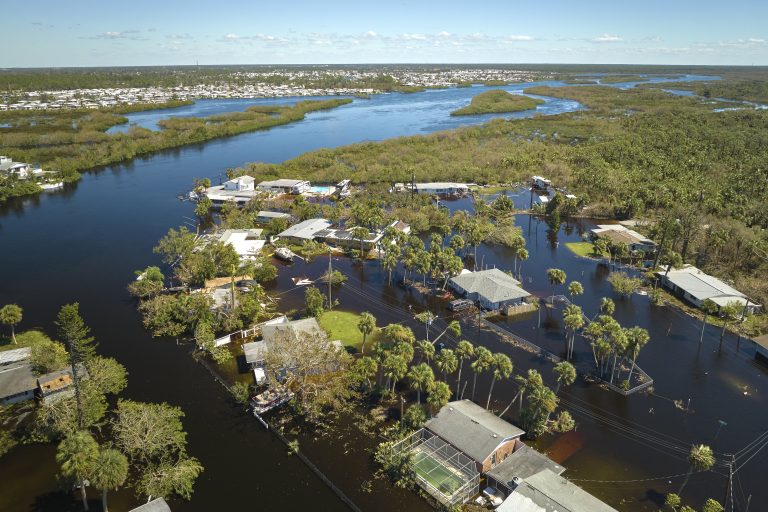
Resilient communities prepare, through hazard assessment, management and oftentimes engineered solutions. We employ state-of-the-art numerical modeling systems to evaluate the extent and timing of flooding impacts, accounting for climate change trends, and quantify wave transformation, runup and erosion rates for given scenarios. Once the hazard risks are better defined, appropriate responses across planning, engineering, and operational considerations can be made.
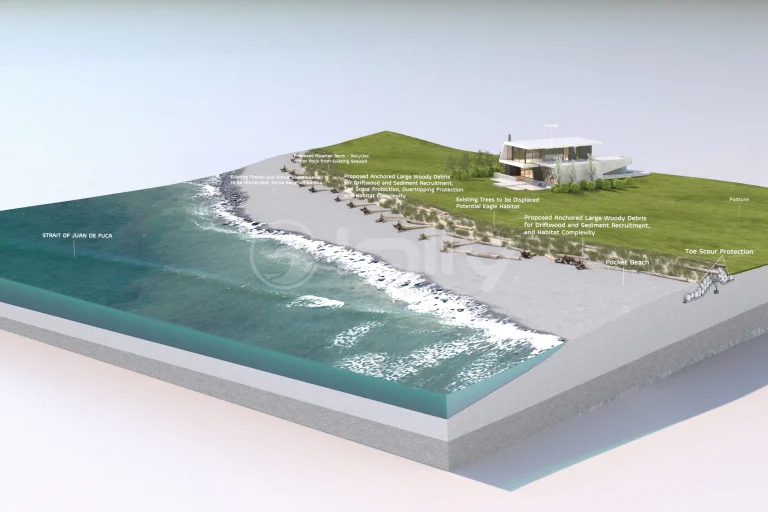
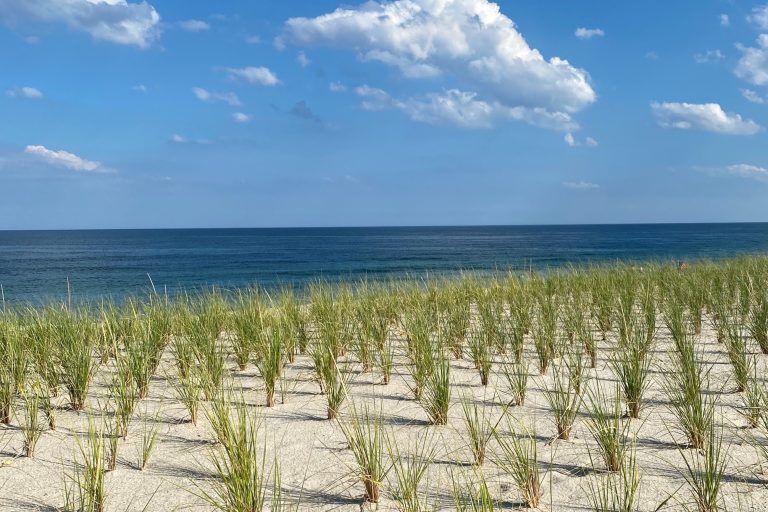
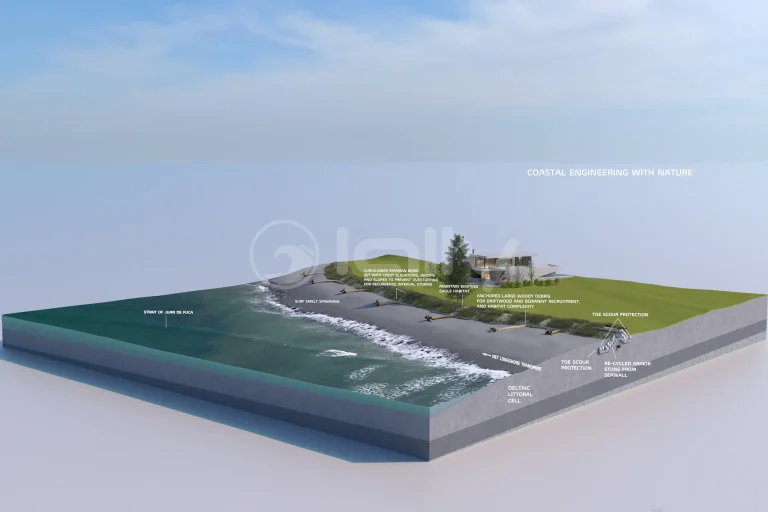
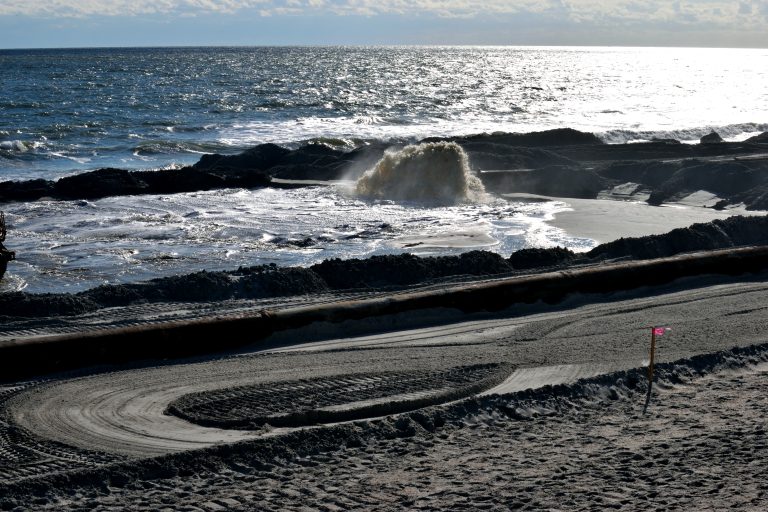
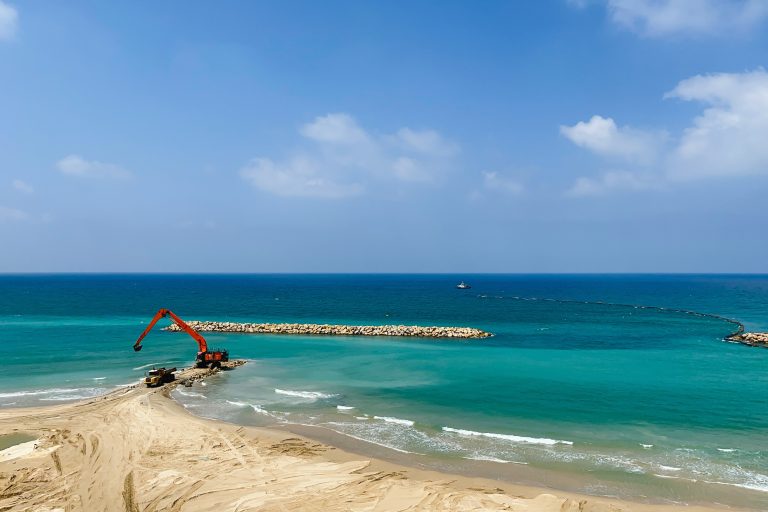
Coastal resiliency solutions include engineered ‘hard’ structures such as breakwaters, revetments, and groin fields, as well as ‘soft’ solutions such as beach restoration / nourishment, and sand-filled geotextile tubes, and increasing in our practice, hybrid solutions involving both hard (gray) and soft (green) engineered designs. Nature-based engineering, which often includes structural habitat components, represents this category of coastal resiliency solution.
For more details on the types of innovative and cost-effective resiliency solutions Lally LLC can lead or contribute to, please explore the pages below.
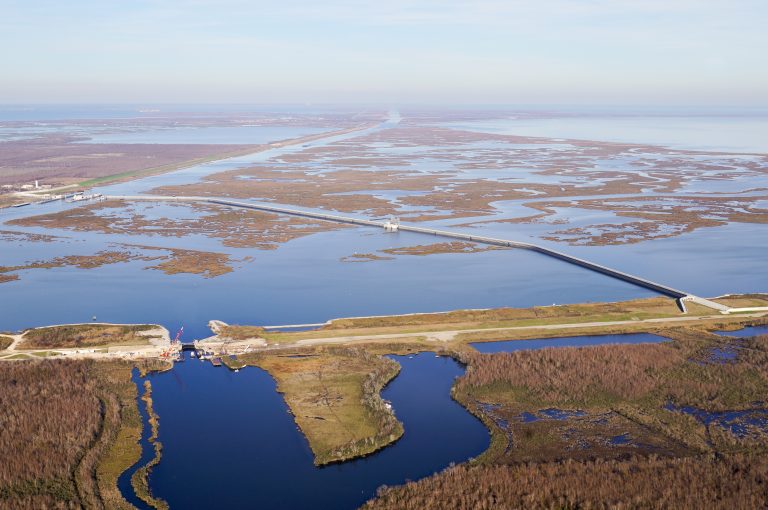
Lally LLC has access to a wealth of hurricane and tropical cyclone (TC) forecasting data, real-time tracking tools and over 30 years’ experience designing for extreme recurrence interval (i.e. 100-year and 500-year) storm events. This knowledge extends from Atlantic and Gulf of Mexico shorelines to the Pacific Rim and Southern Hemisphere.
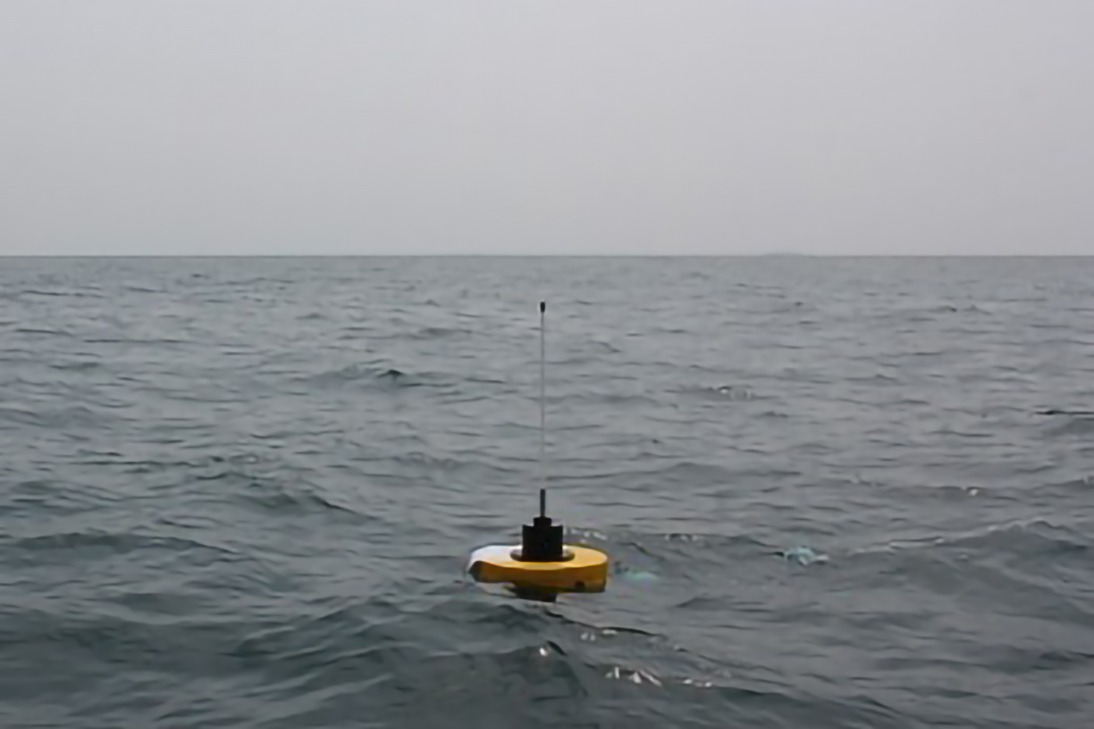
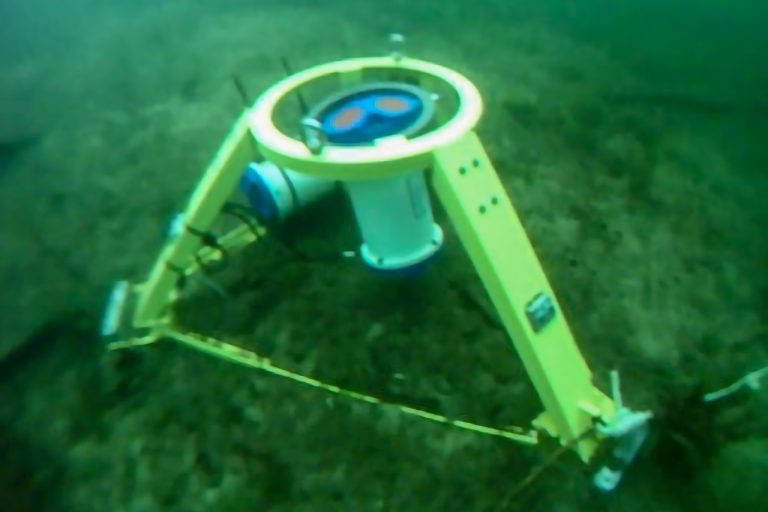
Coastal and offshore owners and operators that plan for disruption will be more resilient in the face of natural disasters. Beyond planning, designing and building assets for an appropriate range of storm intensities, critical steps include storm tracking and property / asset monitoring. As part of our agility service contracts (emergencies and disaster recovery), Lally engineers and scientists can help track and predict tropical cyclones and set up remote environmental monitoring equipment, which can include;
- Anemometers for measurement of windspeed
- Video Monitors for Facility and Equipment Monitoring
- Acoustic Doppler Current Profiler (ADCPs)
- Surface Wave and Pressure Gauges
- Oil Spill and Plume Measurement Devices
- GPS positioning systems
- other remote sensing systems
These monitoring and data collection systems can be deployed prior to hurricane season, or often rapidly ahead of storms from our facilities along the Eastern seaboard, Gulf of Mexico, and CARICOM. Where possible we use leading-edge technology including advanced telemetry communications in order to acquire real-time data from command and relay centers on shore. We also operate rapid deployment mobile offices and have relationships with vessel and aeronautical services enterprises around the globe to support reconnaissance and recovery efforts.
